Table Of Contents
We all have been part of a big project where we hit one roadblock after the other and everyone on the team just seemed to work on totally different things, moving further away from the final goal each and every day. This is exhausting and you just want this project to finally end no matter what the outcome is. On the other hand there are projects that just seem to fall in place and the team works together like a charm from the first day. What if I told you that this is no coincidence, but rather a system everyone can learn. In this article I will show you how Gantt charts can make your life just so much easier for your upcoming small or large project.
This article talks about the various aspects of a Gantt chart – what it is, its history, why it is used, who it is useful for, and how you can leverage this tool in your organization or for your project’s benefit. At its core, Gantt chart is a type of bar chart that illustrates a project schedule. This tool finds wide acceptance across the globe and is being used across industries today with great success. If you are a business leader, an entrepreneur, a project or program manager, or vying to become one, this article will prove to be of great value to you.
A famous quote by the well-known Austrian American management consultant Peter Drucker summarizes the need to have Gantt chart very well.
“Time is the scarcest resource and unless it is managed nothing else can be managed” — Peter Drucker
What is a Gantt Chart
“The Gantt chart, because of its presentation of facts in their relation to time, is the most notable contribution to the art of management made in this generation” — Wallace Clark, Mechanical Engineer
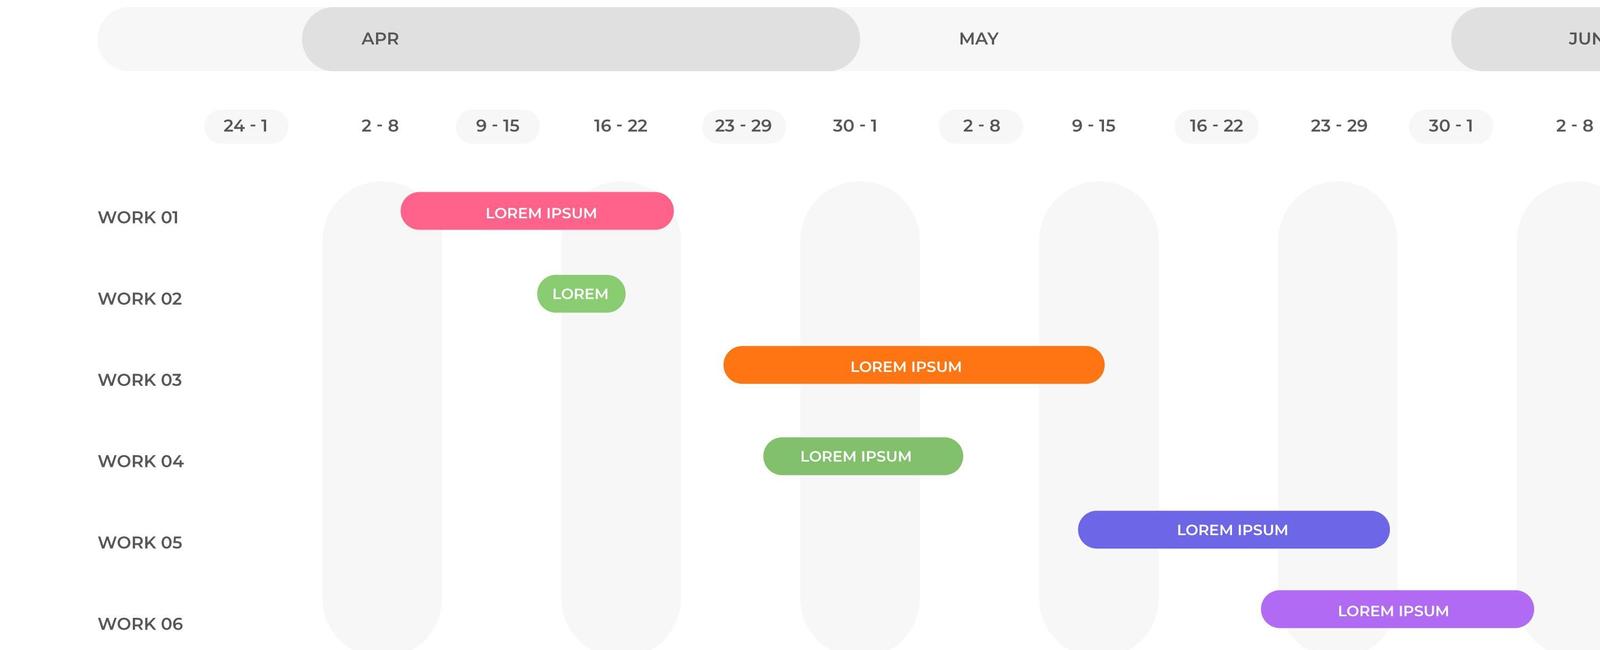
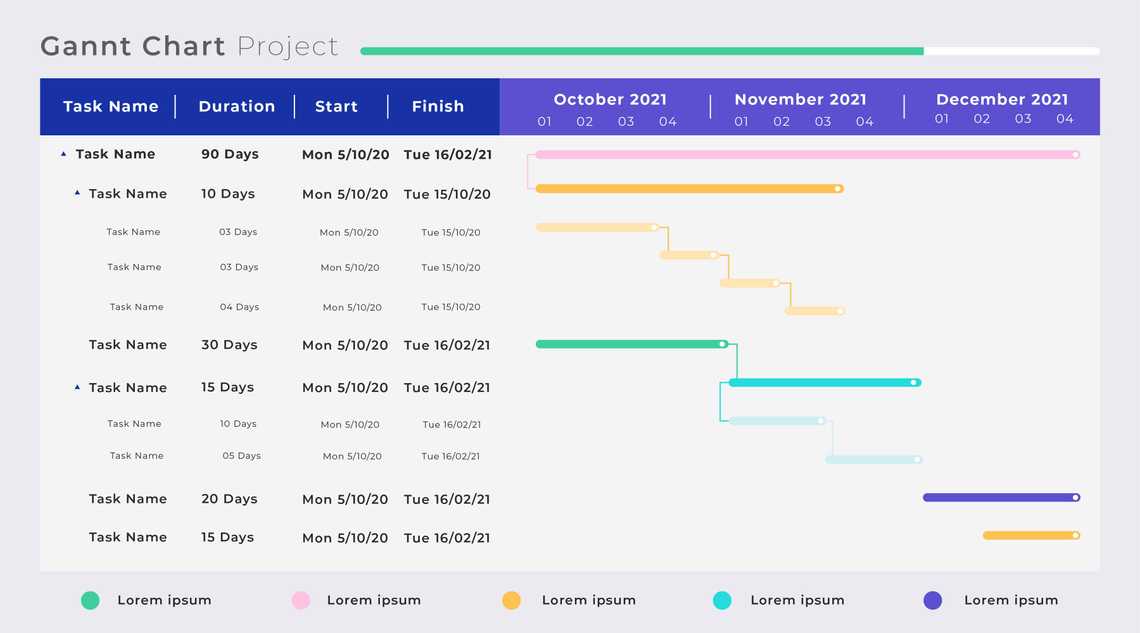
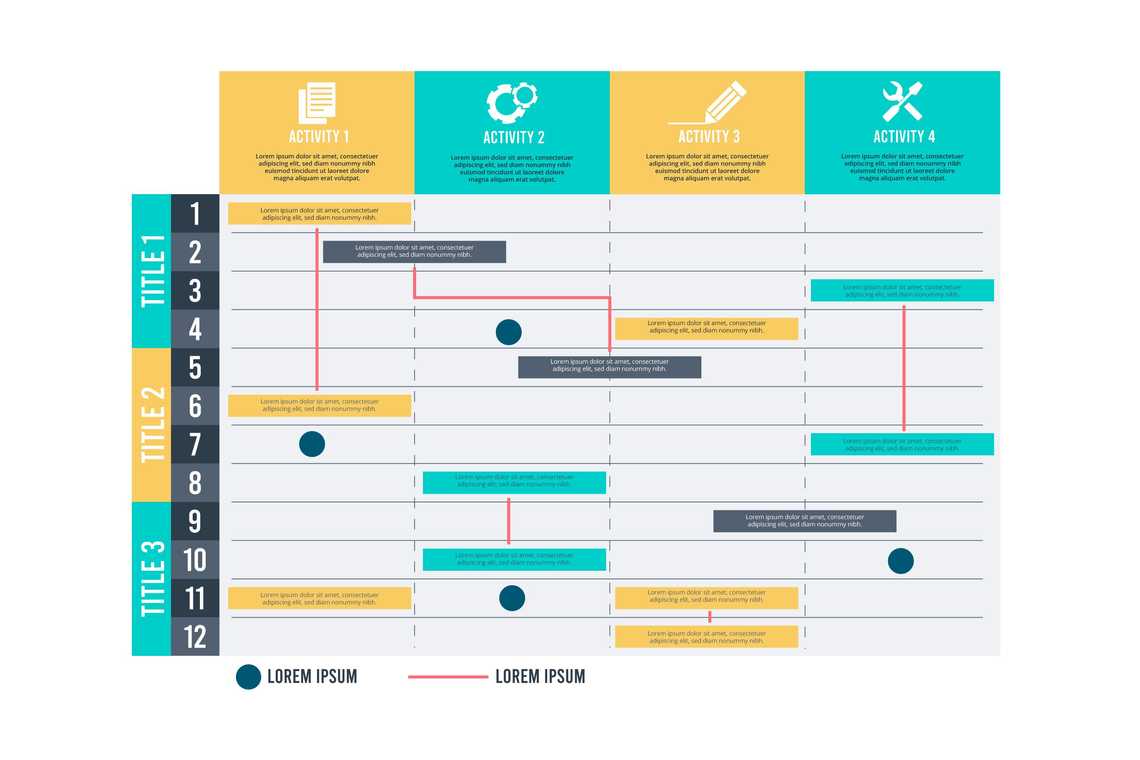
A Gantt chart is one of the most popular and simple ways of showing activities, tasks and events in any project management exercise, along with timelines. Every activity is represented by a bar and the position and length of the bar reflects the start and end date of the activity. The left side is where one can find the list of all activities and along the top is a suitable timescale. Thus, by looking at a Gantt chart, one can figure out the following:
- The list of all activities
- When each activity starts and ends
- The duration of every activity
- Whether activities overlap with each other and by how much
- The start and end dates of the entire project
History of Gantt Chart
The first Gantt chart was devised in the mid-1890s by Karol Adamiecki, a Polish engineer who ran a steelworks in southern Poland. He was deeply interested in management ideas and techniques.
Another American engineer by the name of Henry Gantt who was a project management consultant, devised his own version of the chart some 15 years later. It is his version of the chart that became famous and widely accepted across western countries. Subsequently, Henry’s name was used to refer to the chart, and came to be known as Gantt chart. Gantt originally created his tool for systematic, routine operations. He designed this visualization tool to measure productivity levels of employees more easily and gauge which employees were under- or over-performing. Graphics and other visual indicators were also relied upon by Gantt in his charts to track performance.
Initially, when Gantt charts were being adopted and had just started to gain acceptance, they had to be prepared laboriously by hand. Whenever a project changed, it was important to amend or redraw the chart and this was seen as a major challenge, as it is not uncommon for a project to have multiple changes through its lifecycle. These days, however, Gantt charts can be created, updated and printed easily with the help of computer softwares and readily available tools. One of the first major applications of Gantt charts was by the United States during World War I, at the instigation of General William Crozier.
Presently, Gantt charts are most commonly used for tracking project schedules. For this it is useful to be able to show additional information about the various tasks or phases of the project, including how the tasks relate to each other, how far each task has progressed, what resources are being used for each task and so on.
Progress Gantt Chart
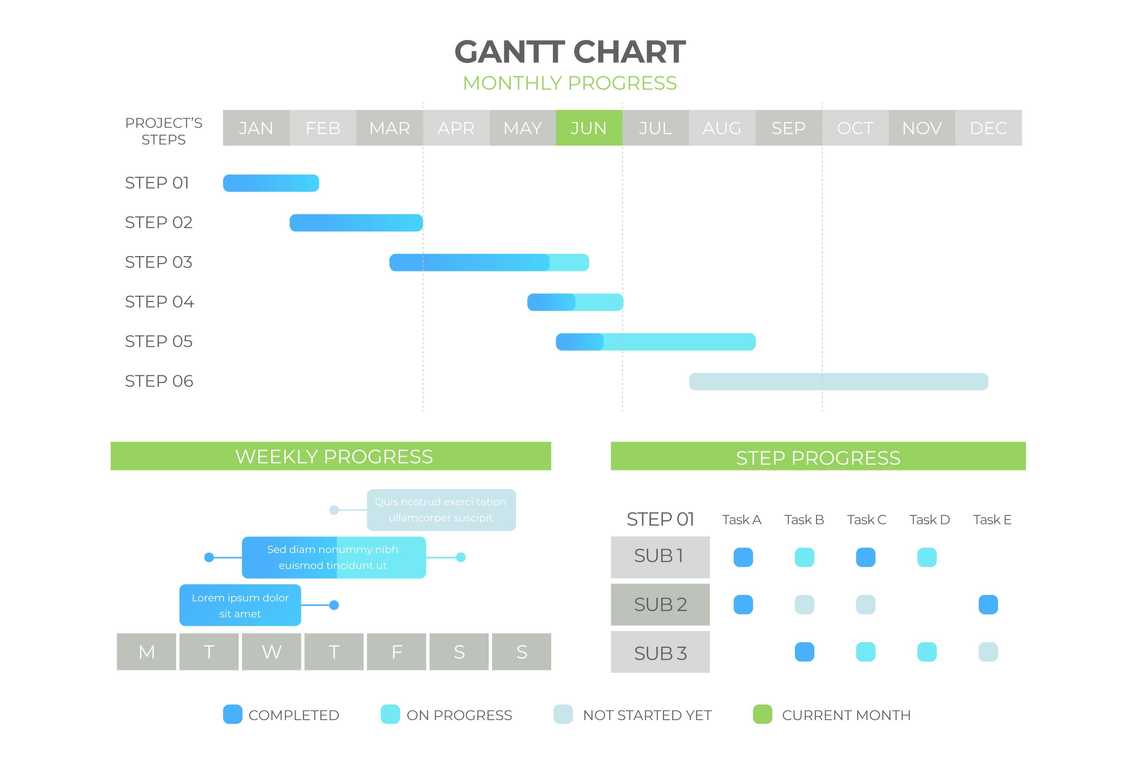
In a progress Gantt chart, tasks are shaded in proportion to the degree of their completion. A task that is 60% complete, would be shaded 60%, starting from the left. A vertical line is drawn at the time index when the progress Gantt chart is created, and this line can then be compared with shaded tasks. If everything is on schedule, all task portions left of the line will be shaded, and all task portions right of the line will not be shaded. This provides a visual representation of how the project and its tasks are ahead or behind schedule
Linked Gantt Chart
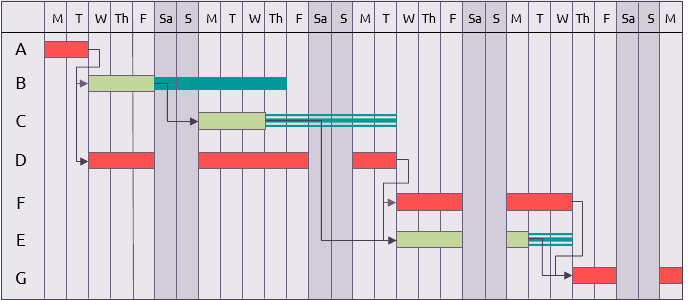
Linked Gantt charts contain lines indicating the dependencies between tasks. However, linked Gantt charts quickly become cluttered in all but the simplest cases. Critical path network diagrams are superior to visually communicate the relationships between tasks. Nevertheless, Gantt charts are often preferred over network diagrams because Gantt charts are easily interpreted without training, whereas critical path diagrams require training to interpret. Gantt chart software typically provides mechanisms to link task dependencies, although this data may or may not be visually represented. Gantt charts and network diagrams are often used for the same project, both being generated from the same data by a software application.
Step by Step Guide for Creating a Gantt Chart
Step 1: Identify Essential Tasks
To begin with, first you need to identify all the essential tasks in your project and list them out. Gantt charts don’t give useful information unless they include all of the activities needed for a project or project phases that are to be completed.
It is important to use a work breakdown structure if you need to establish what the tasks are. Then, for each task, note its earliest start date and its estimated duration.
Step 2: Identify Task Relationships
The various tasks may be related to each other in one way or the other. There are scenarios where some tasks will need to be completed before you can start the next one, and others can’t end until preceding ones have ended. For example, if you’re creating a brochure, you need to finish the design before you can send it to print.
These dependent activities are called “sequential” or “linear” tasks.
Those tasks that can be done at the same time as others, are called “parallel” tasks.
You don’t have to do these in sequence, but you may sometimes need other tasks to be finished first. So, for example, the design of your brochure could begin before the text has been edited (although you won’t be able to finalize the design until the text is perfect.)
You need to identify which of your project’s tasks are parallel, and which are sequential. You must note down the relationship between tasks where tasks are dependent on others. This will give you a deeper understanding of how to organize your project, and it will help when you start scheduling activities on the chart.
Types of Relationship between Tasks
In Gantt charts, there are three main relationships between sequential tasks:
- Finish to Start (FS) – FS tasks can’t start before a previous (and related) task is finished. However, they can start later.
- Start to Start (SS) – SS tasks can’t start until a preceding task starts. However, they can start later.
- Finish to Finish (FF) – FF tasks can’t end before a preceding task ends. However, they can end later. A fourth type, Start to Finish (SF), is very rare.
Things to Note about Task Relationships
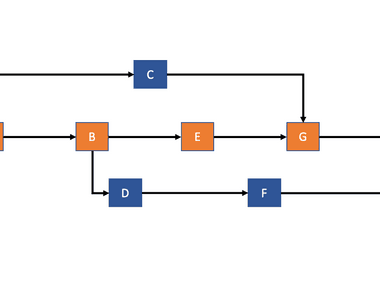
Note 1:Tasks may not have to be only one of the two categories - sequential or parallel. Tasks can be sequential and parallel at the same time – for example, two tasks (B and D) may be dependent on another one (A), and may be completed at the same time. Task B is sequential in that it follows on from A, and it is parallel, with respect to D.
Note 2:To minimize delivery times, the project manager should ensure that as much work in parallel is being done as can be managed. You also need to keep the scope of the project as small as possible.
Step 3: Input Activities into a Template
You can draw your charts by hand or use specialist software, such as Gantto, Matchware, or Microsoft Project. These days, a lot of these tools are cloud-based, that makes it easier for you and your team to access the document simultaneously, from any location.
Several Gantt templates have been created for Microsoft Excel, and you can also find free templates with a quick search online.
Step 4: Chart Progress
It is natural for a project to keep evolving as it moves forward. For example, if quality assurance of core modules revealed a problem, then you may need to delay training, and postpone the development of the management information system until the issue is resolved.
These changes must be updated in your chart to reflect changes as soon as they occur. To keep your plans, your team, and your sponsors up to date, is the most critical responsibility of the project manager.
Conclusion
To sum it up, it may be said that the Gantt chart is one of the best inventions of the last generation, a tool that has made life easy for all project managers, business executives, corporate leaders and even governments around the world. As technology has progressed over the years, there are various cloud-based / on-premises software tools now that help you plan and track your projects. The core of these technology tools still remains the Gantt chart however. Gantt charts have proven their utility and worth; they are here to stay. Hope you learnt something of value by reading this article today. The best way to remember what you’ve learnt and to internalize the learnings would be to start using Gantt charts at your workplace right away.
Related Posts
Quick Links
Legal Stuff


