Introduction
As a project manager, sometimes you may find yourself overwhelmed by the complexity of the project you are asked to manage and deliver. There could be a complex web of interconnected and interdependent activities, teams, processes and timelines that need to be taken into account. As project manager, you are expected to bring them all together and deliver the project in a seamless manner. Of course, it is not as easy as it may seem to others who don’t do this for a living. As a project manager, it is critical to set a logical relationship among all the activities so that everyone understands the nature and sequence of the activities in the project. More often than not, there are multiple teams involved in any project and hence it’s also essential for a central / core project team to decide the dependencies among the activities so that they can work in an ideal manner to accomplish the project goals. Planning to determine the dependencies among the activities is a meticulous task that needs thorough expertise. Now, it is imperative to know how to prepare a network diagram, know the contents of a network diagram, as also the critical path method. But before all, you should first know the definition of a network diagram.
Project Schedule Network Diagram
What is a Project Schedule Network Diagram?
A project schedule network diagram visualizes the sequential and logical relationship between tasks in a project setting. This visualization relies on the clear expression of the chronology of tasks and events.
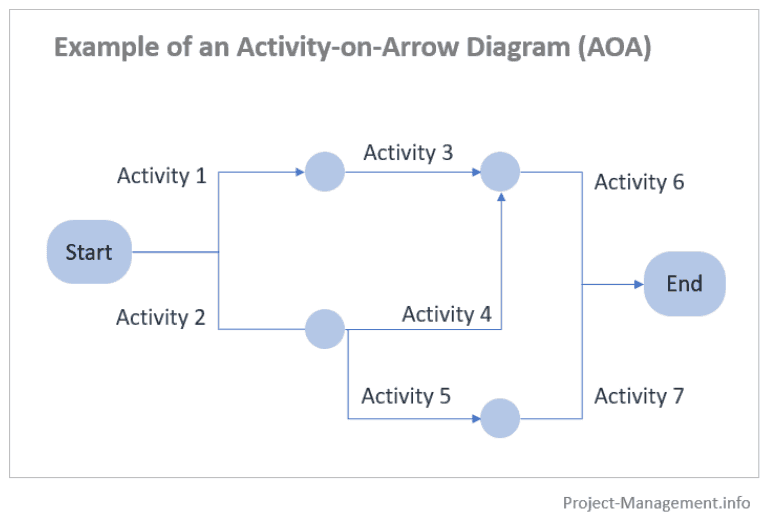
It is basically a graphical representation of the project and is composed of a series of connected arrows and boxes to describe the inter-relationship between the activities that constitute the overall project. Boxes or nodes represent the description of activities and arrows show the relationship among the activities. All the activities fall between Start and Finish. There are so many ways for drawing the network diagram, such as precedence diagramming method (PDM), arrow diagramming method, and GERT (Graphical Evaluation and Review Technique). It is mainly the project managers that use the precedence diagramming process to draw a network diagram. You need to decide which activity is the successor and which one is the predecessor.
As a pre-requisite, you need to create a dependencies chart as well. Additionally, you need to establish logical relationships between the activities before creating this network diagram.
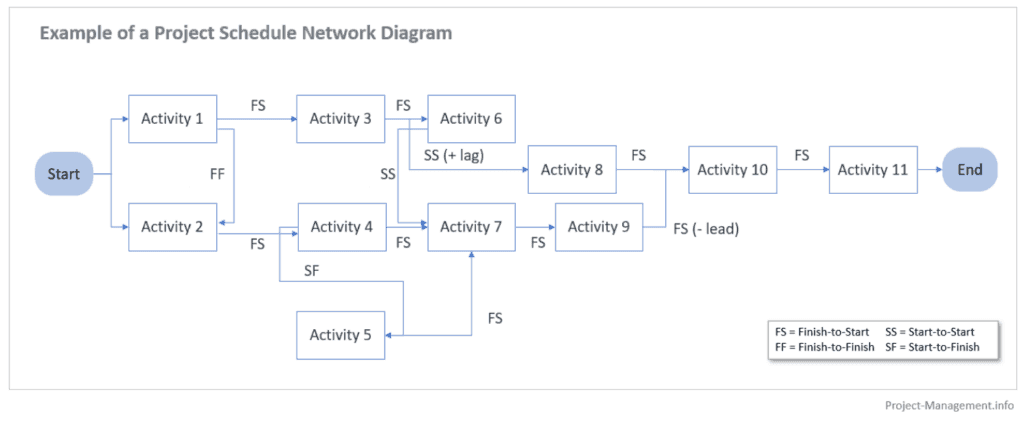
Here are a couple of examples of project network diagram.


Types of Logical Dependencies in a Network Diagram
There are generally four types of logical dependencies in a network diagram:
- Finish to Start: This type of dependency means that you need to wait until the predecessor activity finishes before starting the successor activity. You can’t start the successor activity before completion of the predecessor activity unless some schedule compression technique applies to your project. If you are doing so, the quality will come down. However, in most cases, you cannot begin the next process in any of the above circumstances.
- Start to Start: A predecessor’s activity can start, and after some time the successor activity could start without waiting for the completion of the predecessor activity. You can say that there is a partial dependency among the activities.
- Finish to Finish: The predecessor’s activity must finish before the successor’s activity finishes. It is now rarely used in project management.
- Start to Finish: This type of dependency too is very rarely used these days. What it means is that the previous activity will begin when the successor’s activity finishes.
How to Create a Schedule Network Diagram?
To begin with, you need to make a list of all the relevant inputs of the schedule network diagram which include - the list of defined activities, the estimated durations of these activities and the logical relationships among them (also referred to as dependencies). To draw a schedule network diagram (in line with the AON, or Activities-On-Nodes method), you will need to
- Draw a starting point,
- Insert activities on the (future) nodes of your diagram, including details and additional data (see explanation below),
- Connect the activities with arrows that represent the type of logical relationships,
- Add details to each relationship, such as the type of dependency (e.g. SS, FS), whether it is required or discretionary, leads and lags, as well as other data relevant for your scheduling, and
- Create an endpoint of the diagram.
Advantages of Network Diagram
It is advised that you shouldn’t start working on your project without preparing a Network Diagram. It is imperative to develop the Network Diagram before proceeding with your project work. Typically, there are a lot of stakeholders in any project. A project manager should involve all stakeholders, including the core team members while preparing the Network Diagram. The Network Diagram can, and should be referred to by the project manager every time a new resource or a group of new team members become part of the project, to let them understand the project details.
There could be some mandatory dependencies which may not be converted into soft logic dependencies. Your Network Diagram should be prepared accordingly, reflecting those scenarios. Based on this Network Diagram, you will be getting overall project duration after incorporating the number of resources and the number of working hours (or any similar metrics) against every activity. Accumulating these lets you derive overall project schedule. In conclusion, you can now very well understand how critical this tool is for a project manager while accomplishing the project goal.
Critical Path Method
What is Critical Path Method?
Critical path method is one of the most frequently used techniques in project planning. As we discussed before, a typical project has many tasks involving lots of different people so project managers have a hard time keeping track of things. It is quite possible that certain activities may fall behind and get lost in the sea of endless jobs, and may be overlooked by the project manager if not tracked diligently. These forgotten tasks and errors in planning can severely affect the timescale of the whole project. The consequences of a late project can be severe, including monetary losses and unhappy customers. Critical path method in project management helps managers figure out two very important things. How long it will take to complete the project and what are the critical tasks that must be completed before starting other dependent tasks. Using the Critical Path Method in the project schedule network diagram makes it easy to visualize the important tasks of a project. This is really helpful for managers and makes it easier for the project team to visualize and plan their work accordingly. The objective is to produce a visual representation of the entire project broken down into smaller activities which are vital to the completion of the entire project. All of the activities which are added to the network diagram are the ones which have to be completed on time. By adding them on to a diagram it is possible to see how long each section will take. This is absolutely imperative when it comes to predicting the timescale of the project. Of course, at the beginning of the project, time taken for each task is the estimated time. During the project the actual time taken might vary based on different factors. In such cases, you must revisit your diagram and again do a critical path analysis. This doesn’t happen too frequently, but must be done when it does.
How Critical Path Helps Scheduling?
The critical path method not only shows you how long each task is going to take, but also helps you prioritize them. The critical path method tells you all the tasks that need to be completed on time for the project to stay on track. It also tells you all those tasks that can afford an inadvertent or deliberately introduced delay, and by how much they can be delayed without the overall project delivery schedule getting affected.
Example of a Critical Path
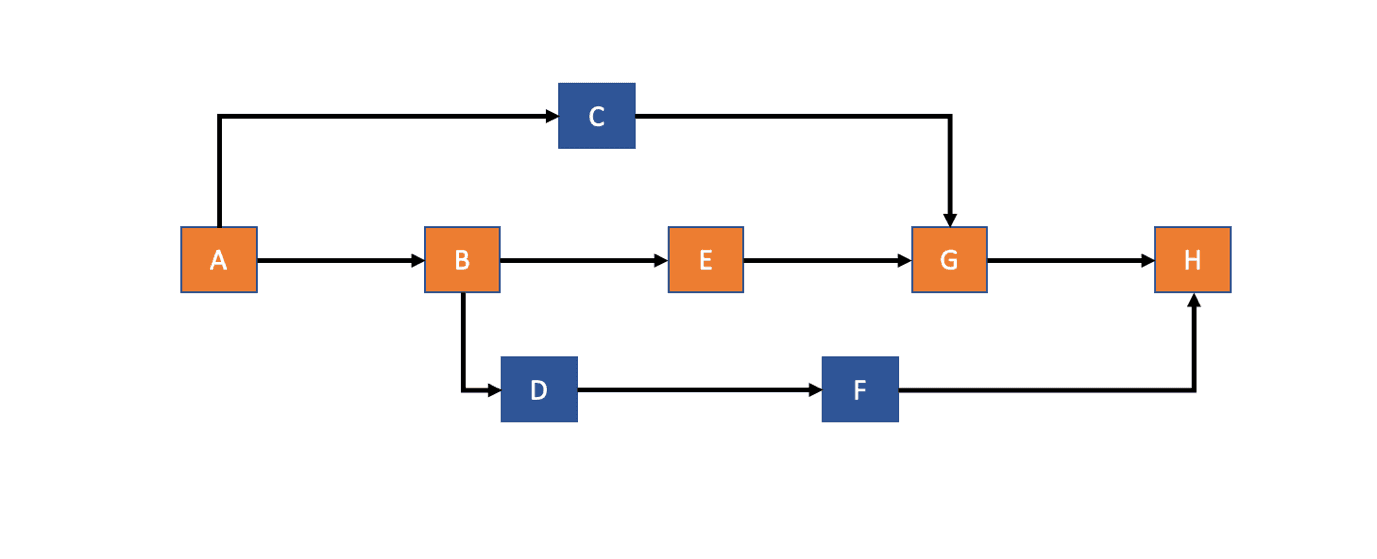
This is an example at a very high level, but enough to help you understand the concept. Steps in orange colour constitute the critical path in the below image. Delay in any one of these steps marked in orange will most certainly lead to an overall delay in the entire project unless the lost time is made up for in another task in the critical path itself.

Conclusion
A project schedule network diagram is one of the most useful and important tools for project managers to visualize the sequential and logical relationship between tasks in a project setting. It is not just a mere graphical representation of the project, but carries important information that different stakeholders can derive in a simple and efficient manner. The critical path method helps project managers to ensure that the project is delivered in time, by identifying the most critical items. Any delay in one of these critical path tasks leads to the overall project getting delayed. As a project manager, you must get yourself fully acquainted with these tools to help you fulfil your responsibilities and make a mark for yourself in the organization you work for.
Related Posts
Quick Links
Legal Stuff


